
You Don’t Need a Million Dollars to Retire — You Need Your Number
- Joe Boughan

- Dec 19, 2025
- 7 min read
Most people don’t struggle with retirement because the math is complicated.
They struggle because they’ve been handed answers that were never meant for them in the first place.
Somewhere along the way, retirement planning became a collection of shortcuts:
a million dollars,
two million dollars,
the 4% rule,
20 times your expenses.
Each one sounds reasonable. Each one feels concrete. And none of them actually know you.
They don’t know what you spend. They don’t know what income you can count on. They don’t know whether your house is paid off, whether you’ll have a pension, or how your priorities will change once work is no longer the center of your life.
As a result, many thoughtful, disciplined savers end up stuck in the same uncomfortable place — not because they’re doing something wrong, but because the framework they’re using was never designed for individual decisions. Some people work years longer than they need to. Others retire with quiet uncertainty that could have been avoided.
The real question isn’t, “How much money do I need to retire?”
It’s whether the numbers in your life actually line up in a way that supports the life you want.
This article walks through a simpler, more personal way to think about retirement readiness — not by chasing textbook averages, but by focusing on the three numbers that tend to matter most. When those numbers come into focus, retirement stops feeling abstract. It becomes measurable. And for many people, that moment of clarity arrives sooner than they expect.
If you want to talk with a financial planner for help here, consider reaching out to us after looking through the article:
Why Traditional Retirement Benchmarks Fall Short

Rules of thumb exist for a reason. They simplify complex ideas and make them easier to communicate. The problem isn’t that retirement benchmarks exist—it’s that they’re often mistaken for personalized answers.
Each of these ideas is rooted in research or convention.
But each also strips away the details that actually determine whether retirement works in real life.
From a behavioral finance standpoint, this makes sense. Humans are drawn to round numbers and simple rules because they reduce uncertainty.
The unintended consequence is that many people anchor to a number that was never calibrated to their situation. They delay decisions, doubt themselves, or assume they’re behind when they may not be.
The 4% Rule: Useful Context, Often Misapplied
The 4% rule is one of the most widely cited retirement concepts, originating from research known as the Trinity Study.²
At a high level, it examined historical market data to estimate how much a retiree could withdraw annually from a diversified portfolio over a 30-year period.
The takeaway that stuck? Roughly 4%.
What’s often missed are the assumptions:
A specific stock/bond mix
No consideration of taxes
A fixed time horizon
Inflation-adjusted withdrawals regardless of market conditions
No adjustment for changing spending patterns
Perhaps most interestingly, later research and real-world data suggest that retirees who rigidly follow conservative withdrawal rules often finish retirement with significantly more wealth than they started with.³
That outcome isn’t necessarily bad—but it does raise an important question:
What did they give up along the way?
For many people, the issue isn’t that they spent too much. It’s that they never gave themselves permission to spend at all.
Reframing the Question: Income, Not Account Balances
We rarely ask how much money we need in an account to live our lives. We ask how much income supports the life we want.
Retirement is no different.
A more useful starting point is:
What do I actually spend?
What income sources can I count on?
What role does my portfolio need to play?
This shift—from accumulation to income—is where many people get stuck emotionally. Decades of saving condition us to avoid withdrawals. Behavioral researchers refer to this as loss aversion: spending from a portfolio feels like losing, even when it’s the intended purpose of the money.⁴
Clarity begins when we reconnect the portfolio to its job.
What Income Replacement Studies Get Right—and Where They Stop
Large institutions like JP Morgan publish income replacement studies that attempt to estimate how much savings might be needed to replace a percentage of pre-retirement income.
For example, their research often assumes retirees will need roughly 70–80% of gross income, reflecting the idea that some expenses fall away in retirement.⁵ These charts are far more grounded than generic benchmarks and can be helpful as a starting reference.

But they still rely on assumptions:
Retirement at a specific age
A standardized asset allocation
Linear spending over time
No differentiation between lifestyles or goals
Real retirement spending is rarely linear. Early years often include travel, experiences, and family support. Later years may look very different. Averages smooth over exactly the variability that matters most.
The Three Numbers That Actually Matter
1. Your Real Spending Need
The first and most important number is what it actually costs to live your life.
A practical way to approach this:
Start with gross income
Subtract taxes and savings
Remove expenses that won’t exist in retirement (commuting, payroll deductions, mortgage if paid off)
Adjust for how you expect spending to change
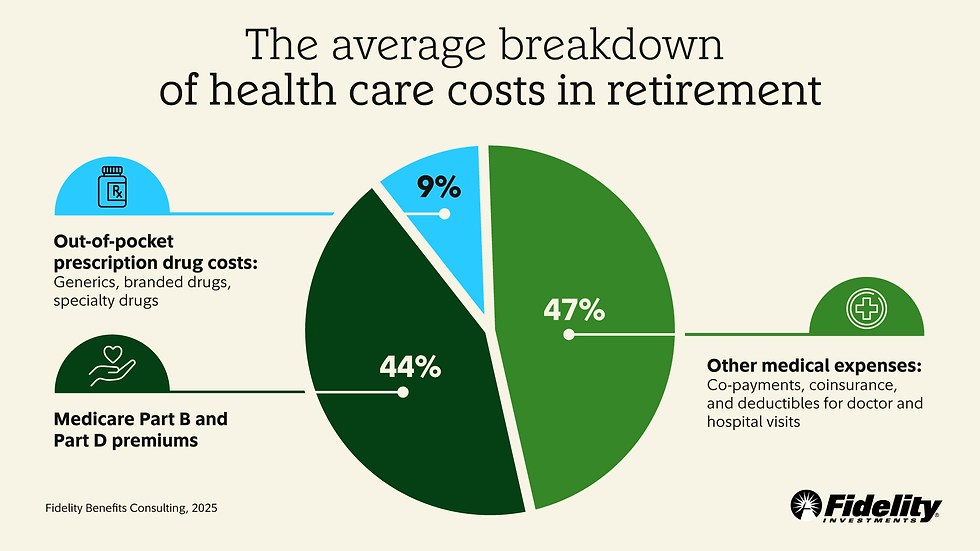
Healthcare deserves special attention here.
According to Fidelity, a typical retiree couple may spend hundreds of thousands of dollars on healthcare costs over retirement.⁶ The exact number varies widely, but ignoring it entirely creates blind spots.
This process isn’t about precision—it’s about realism.
2. A Withdrawal Rate That Fits Your Situation
Withdrawal rates are not universal. They depend on:
Asset allocation
Time horizon
Spending flexibility
Guaranteed income sources
Personal risk tolerance
Legacy goals
Academic research—including expanded analyses of the Trinity Study—shows a wide range of sustainable outcomes depending on these factors.²
A lower withdrawal rate increases certainty but may reduce lifestyle flexibility. A higher rate may be reasonable when:
Spending is front-loaded
Income sources increase later
The time horizon is shorter
Flexibility exists to adjust if markets disappoint
The goal isn’t to maximize a percentage. It’s to find a rate that fits your life without requiring constant stress.
3. Your Retirement Readiness Snapshot
This is where the numbers come together.
A simple framework:
Take your monthly spending need
Annualize it
Gross it up modestly for taxes (often ~15% as a rough estimate)
Subtract reliable income sources:
Social Security (see SSA estimates⁷)
Pensions
Rental income
What remains is your portfolio burn rate.
Dividing that number by your personalized withdrawal rate gives you a target portfolio size—not a magic number, but a working reference point.
If you plan to retire before claiming Social Security, additional bridging capital may be required. These adjustments are where personalization matters most.
A Real-Life Example
Imagine a 55-year-old individual with:
$1,000,000 invested
Desired spending of $7,000 per month
Annual spending: $84,000Add ~15% for taxes → ~$96,600
Assume Social Security at 62 of $3,000/month ($36,000/year).
Adjusted portfolio need: ~$60,600.
If a 4.75% withdrawal rate aligns with their allocation and risk tolerance, the implied target portfolio is a little over $1.2 million.
This doesn’t produce a verdict. It produces context.
The conversation shifts from “Can I retire?” to “How do I bridge the gap, if one exists?”
That might involve:
Working a bit longer
Adjusting spending expectations
Refining investment strategy
Considering part-time work
Re-running assumptions over time
None of those are failures. They’re options.
Why This Framework Changes How Retirement Feels
Most retirement anxiety isn’t driven by numbers. It’s driven by ambiguity.
Generic benchmarks create a moving target. Personalized frameworks create reference points. Behavioral research consistently shows that uncertainty amplifies stress, while context reduces it—even when outcomes don’t change.⁸
When people understand why a plan works (or doesn’t), decisions feel calmer and more deliberate.
What This Framework Is—and Isn’t
This is not a complete retirement plan.
A full plan also considers:
Tax strategy
Investment design
Withdrawal sequencing
Social Security optimization
Risk management
Estate considerations
But without clarity on your number, those layers sit on shaky ground.
This framework is a starting point—one that replaces rules of thumb with alignment.
Final Thoughts
What this approach offers isn’t certainty.
Retirement planning rarely works that way. What it offers is something sturdier: a way to replace guessing with structure, and anxiety with perspective.
For some people, the numbers confirm they’re closer than they thought. For others, they highlight manageable gaps and practical choices. Either way, the value is clarity.
If you’re trying to make sense of your own retirement numbers, working with a fiduciary planner who can model this specifically for your situation can remove a lot of unnecessary uncertainty.
At Parkmount Financial, we work with individuals and families in the Boston area, and virtually with clients across the U.S. where licensed or exempt, to help turn abstract retirement questions into informed decisions.
You shouldn’t have to guess about when you can retire. Clarity changes the conversation.
👉 Learn more or request a conversation here:
Free Video Article Here:
“Parkmount Financial Partners LLC” (herein “Parkmount Financial”) is a registered investment advisor offering advisory services in the State[s] of Massachusetts and in other jurisdictions where exempt. Registration does not imply a certain level of skill or training.
The information on this site is not intended as tax, accounting or legal advice, as an offer or solicitation of an offer to buy or sell, or as an endorsement of any company, security, fund, or other securities or non-securities offering. This information should not be relied upon as the sole factor in an investment making decision.
Past performance is no indication of future results. Investment in securities involves significant risk and has the potential for partial or complete loss of funds invested. It should not be assumed that any recommendations made will be profitable or equal any performance noted on this site.
The information on this site is provided “AS IS” and without warranties of any kind either express or implied. To the fullest extent permissible pursuant to applicable laws, Parkmount Financial disclaims all warranties, express or implied, including, but not limited to, implied warranties of merchantability, non-infringement, and suitability for a particular purpose.
Parkmount Financial does not warrant that the information on this site will be free from error. Your use of the information is at your sole risk. Under no circumstances shall Parkmount Financial be liable for any direct, indirect, special or consequential damages that result from the use of, or the inability to use, the information provided on this site, even if Parkmount Financial or a Parkmount Financial authorized representative has been advised of the possibility of such damages. Information contained on this site should not be considered a solicitation to buy, an offer to sell, or a recommendation of any security in any jurisdiction where such offer, solicitation, or recommendation would be unlawful or unauthorized.


Comments